This resource is available in Spanish
Climate change intensifies heat waves, wildfires, droughts, floods, and hurricanes, making them more severe. In some cases, climate change can increase the likelihood of these events happening. When reporting on extreme weather, journalists should explain how they are connected to climate change. To make those connections, find sample language and real-world examples in our guide, “Making the Climate Connection.”
This guide summarizes how climate change affects various types of extreme weather and explains attribution science — the science that calculates how strong of an influence climate change has on a given weather event. Many of the explanations are excerpted, with permission, from toolkits produced by Climate Central, a scientific organization that studies and reports on climate change. See links to their toolkits, which include climate facts and graphics that reporters can use, and links to climate guides created by SciLine, which provides scientific information for journalists.
The Climate Science Behind Disasters
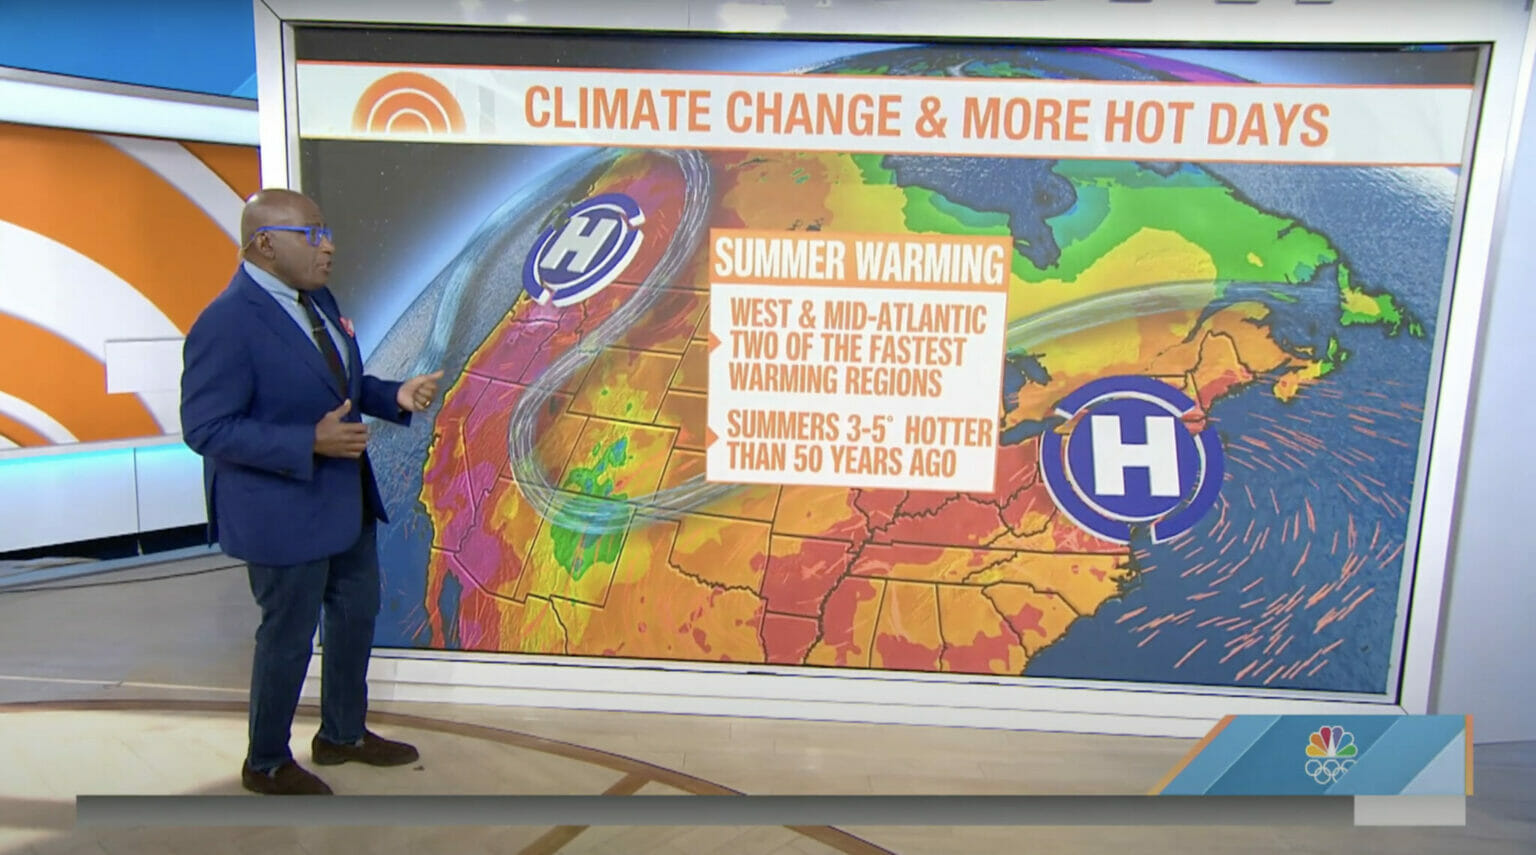
Extreme Heat & Heatwaves. The increase in extreme heat is a direct result of our warming planet. As greenhouse gas emissions have trapped more heat in the atmosphere, heatwaves are getting hotter and longer, and the number of record high temperatures are dramatically outpacing record low temperatures. See more at Climate Central and SciLine.
Heavy Rain & Flooding. Climate change is bringing heavier rainfall and increased flood risk to many parts of the US. As global temperatures rise, more water evaporates from soils, plants, lakes, and oceans. When this additional water vapor condenses into precipitation, it leads to heavier rain — or, when cold enough, heavier snowfalls. See more at Climate Central and SciLine.
Coastal Flooding. Coastal flooding is on the rise. As the world warms, glaciers and ice sheets melt into the oceans, expanding their volume. At the same time, the volume of the water itself expands when warmed. These two elements contribute to sea-level rise. Globally, sea levels have risen about 7 inches since the beginning of the 20th century. This heightened level of water is increasing the number of coastal floods during regular high tides and during coastal storms, whether those storms are tropical systems or non-tropical systems such as Nor’easters. See more at Climate Central and SciLine.
Drought. Rising global temperatures are altering the water cycle and increasing the risk of drought in parts of the US. As global temperatures continue to climb, evaporation rates also increase. Those higher evaporation rates dry out soil faster, making droughts worse. A dry ground also heats up more easily. The additional heat drives further evaporation, further worsening the drought — a vicious cycle. See more at Climate Central and SciLine.
Hurricanes & Tropical Cyclones. Warming oceans are fueling stronger tropical cyclones — the most costly weather disasters. Tropical cyclones, the more general term for hurricanes and tropical storms, get their energy from the warm ocean water. More than ninety percent of the additional heat entering Earth’s atmosphere is going into the oceans. While the number of tropical cyclones is not necessarily increasing, those that do form can become more destructive — producing heavier rain and a higher storm surge. Early research also suggests that warmer oceans cause hurricanes to intensify more rapidly, giving coastal areas less advance warning. See more at Climate Central and SciLine.
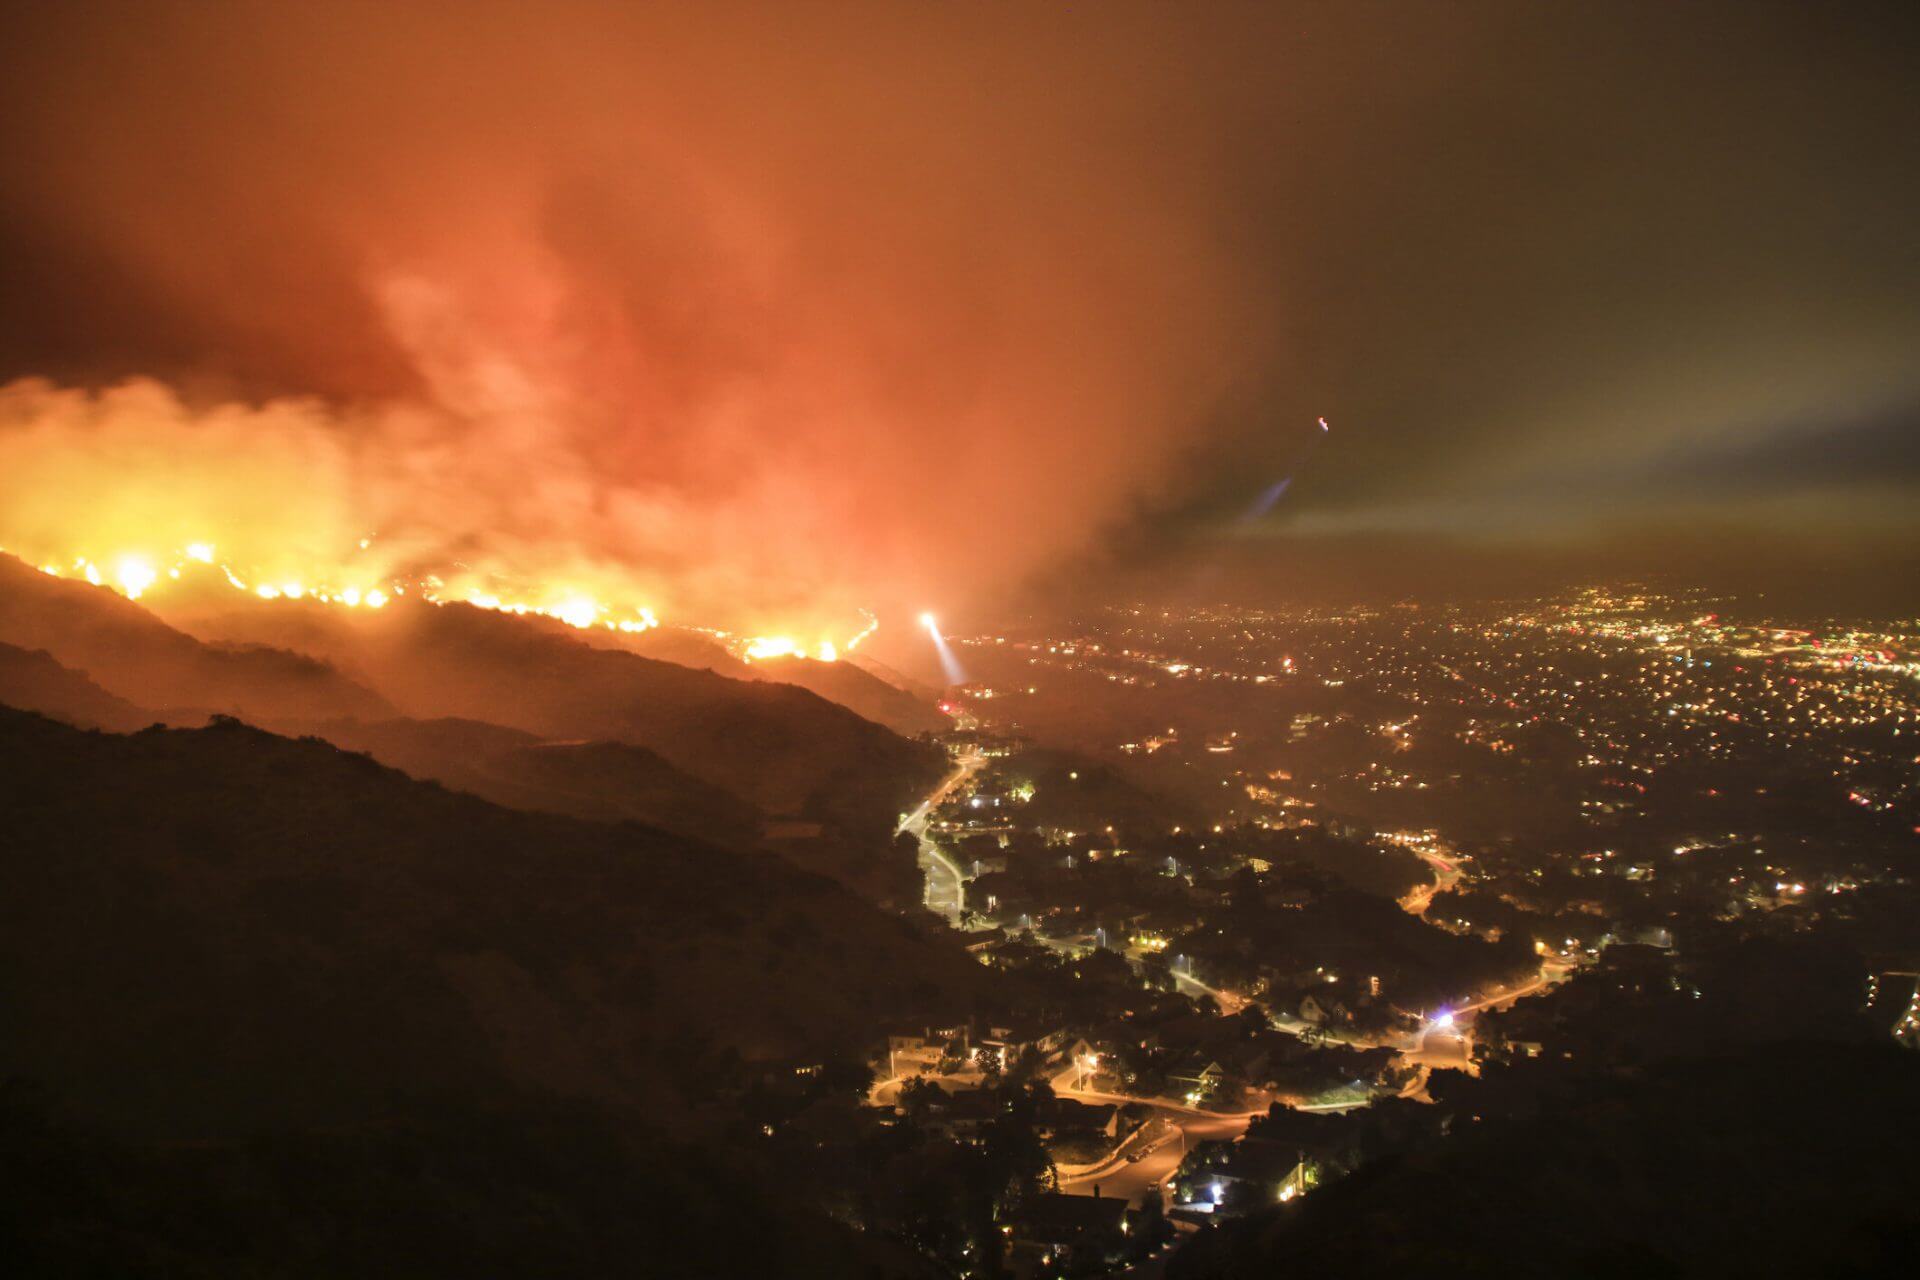
Wildfires. More frequent hot, dry, and windy conditions contribute to more wildfires that put people and ecosystems at risk. Dry winters, early-onset springs, and drier soil turn trees into kindling for wildfires. The annual average wildfire season in the Western US is now 105 days longer, burns six times as many acres, and has three times as many large fires (more than 1,000 acres) than in the 1970s. Scientists project this trend to continue as temperatures keep rising. See more at Climate Central and SciLine.
Snow & Ice. The timing, location, and amount of snowfall is shifting across the US. Even in a warming world, there will still be snow. But on average, snow cover across the Northern Hemisphere is declining, with the decreases most pronounced in spring and fall. However, snow may be heavier in places where it is still cold enough to snow, leading to more intense precipitation. See more at Climate Central and SciLine.
Climate Attribution Science
Scientists can now calculate if, and to what degree, climate change affects the likelihood and intensity of individual extreme weather events. Sometimes, these calculations are available within 48 hours of an event’s occurrence. Scientists compare current climate data with computer models that simulate the conditions of the pre-industrial era before the rapid increase of fossil-fuel emissions.
Attribution science gives us the tools to explain the climate connection to our audience. For example: “This event was made twice as likely and 30 times more intense by human-caused climate change.”
To be clear, it cannot tell us if an event was caused by climate change because all weather events have multiple causes. Some extreme weather events, such as those related to heat and rainfall, are easier to study than others, such as those related to wildfires, droughts, or tornadoes.
The World Weather Attribution initiative, a collaboration of leading scientists, is an organization that provides assessments of some extreme weather events. Journalists can cite these studies to help audiences understand how climate change is impacting specific weather events. See more at WWA: “Reporting Extreme Weather and Climate Change.”
In addition to the World Weather Attribution scientists, Climate Central’s ‘Climate Shift Index’ is a real-time tool journalists can use to identify the impact climate change is having on daily, local temperatures worldwide. As described here, the index uses attribution science to indicate whether climate change made a daily high or low temperature more likely, less likely, or had no impact at all.